
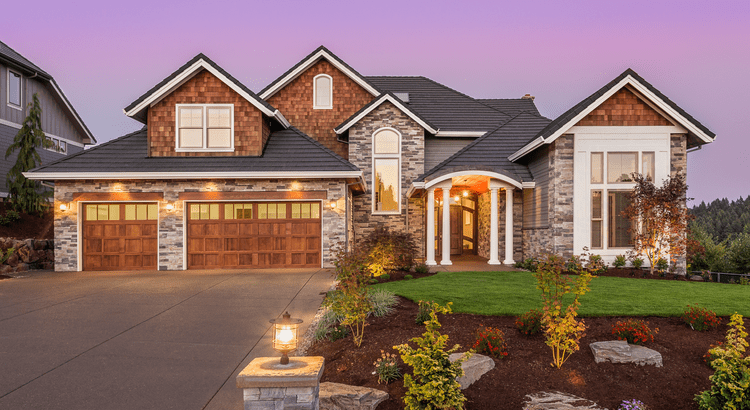
If buying a home is on your radar, you’ve probably been keeping an eye on mortgage rates and home prices. But don’t forget about homeowners insurance.
If buying a home is on your radar, you’ve probably been keeping an eye on mortgage rates and home prices. But don’t forget about homeowners insurance.

If buying a home is on your radar, you’ve probably been keeping an eye on mortgage rates and home prices. But don’t forget about homeowners insurance.

After more than a year of headlines talking about how home prices are going to crash, the latest data shows that price growth may be starting to pick back up again.

After more than a year of headlines talking about how home prices are going to crash, the latest data shows that price growth may be starting to pick back up again.
If you own a luxury house, you’re in a stronger spot than most sellers right now. While much of the market has cooled, the high-end tier hasn’t.

If you own a luxury house, you’re in a stronger spot than most sellers right now. While much of the market has cooled, the high-end tier hasn’t.
Remember how exciting it was to buy your first place?

Today’s home prices have a lot of buyers – especially first-time buyers – wondering if there’s even anything out there that’s in their budget.

If you’ve thought about buying a home in the past few years, you may have run into two frustrations: asking prices that kept climbing and too few homes to choose from.
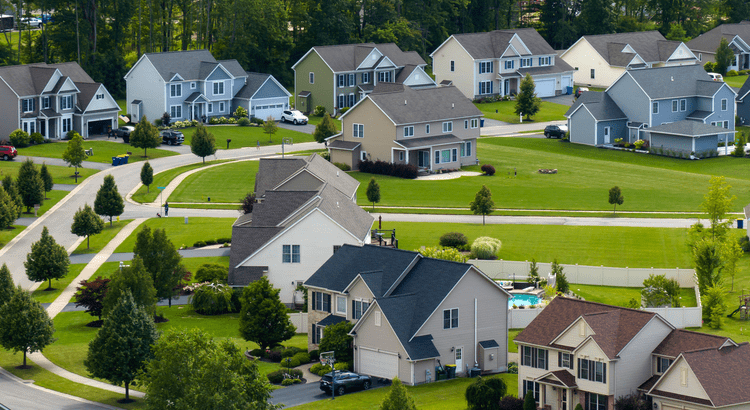
If you’ve thought about buying a home in the past few years, you may have run into two frustrations: asking prices that kept climbing and too few homes to choose from.